
Information about Change Processing throughput
Throughput values for apply throughput in a change-processing operation provide information on how fast the change records are loaded to the target endpoint. The information is displayed in a gauge in the Change-Processing graph section. The following figure shows the Apply Throughput gauge:
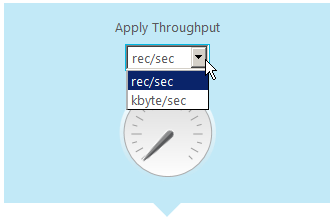
You can set the Apply Throughput measurement values either to the number of change records replicated per second, or to the number of kilobytes replicated per second. The display is always based on the current load operation.
To set the unit of throughput measurement:
- Select either rec/sec or kbyte/sec from the drop-down menu below the Apply Throughput gauge.
Click the Apply Throughput gauge to display a graph with the throughput details as shown in the figure below. To view the graph only, click the expand/collapse arrow in right side of the gray bar above the graph. Click the arrow again to restore the progress bars and Change Processing gauges.
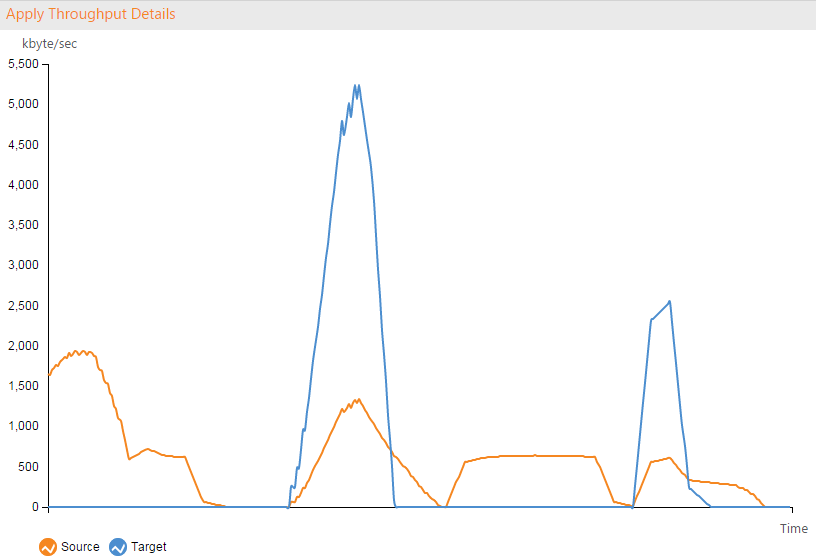
The Apply Throughput metrics represented by the graph may not be always accurate. For accurate metrics, check the gauge described above.